

As we noted yesterday, occasionally we at Marijuana Stocks make a strong “push” or case for certain pot stocks and cannabis companies. These are companies that we believe strongly in for the long haul with solid and experienced management teams. And our recent feature profile, Premier Health Group Inc. (OTC: PHGRF) / (CSE: PHGI), has recently started to gain a lot of interest.
In yesterday’s feature, we brought to your attention a certain technical chart setup that appeared to be forming in both the US and Canadian markets known as a descending triangle. And today we may have just seen a triggering breakout to that pattern.
Descending triangles can either be continuation or reversal patterns. According to Investopedia.com, traders often try to initiate short positions when identifying a descending triangle in anticipation of the bottom support of the triangle to breakdown. However, Investopedia.com also warns about the limitations shorting a descending triangle and points towards the risk of a false breakdown when the pattern breaks out in the opposite direction. This type of action could trigger a short squeeze. And it’s possible that this is exactly what we started to see on February 25, 2019.
U.S. Markets (OTC: PHGRF)
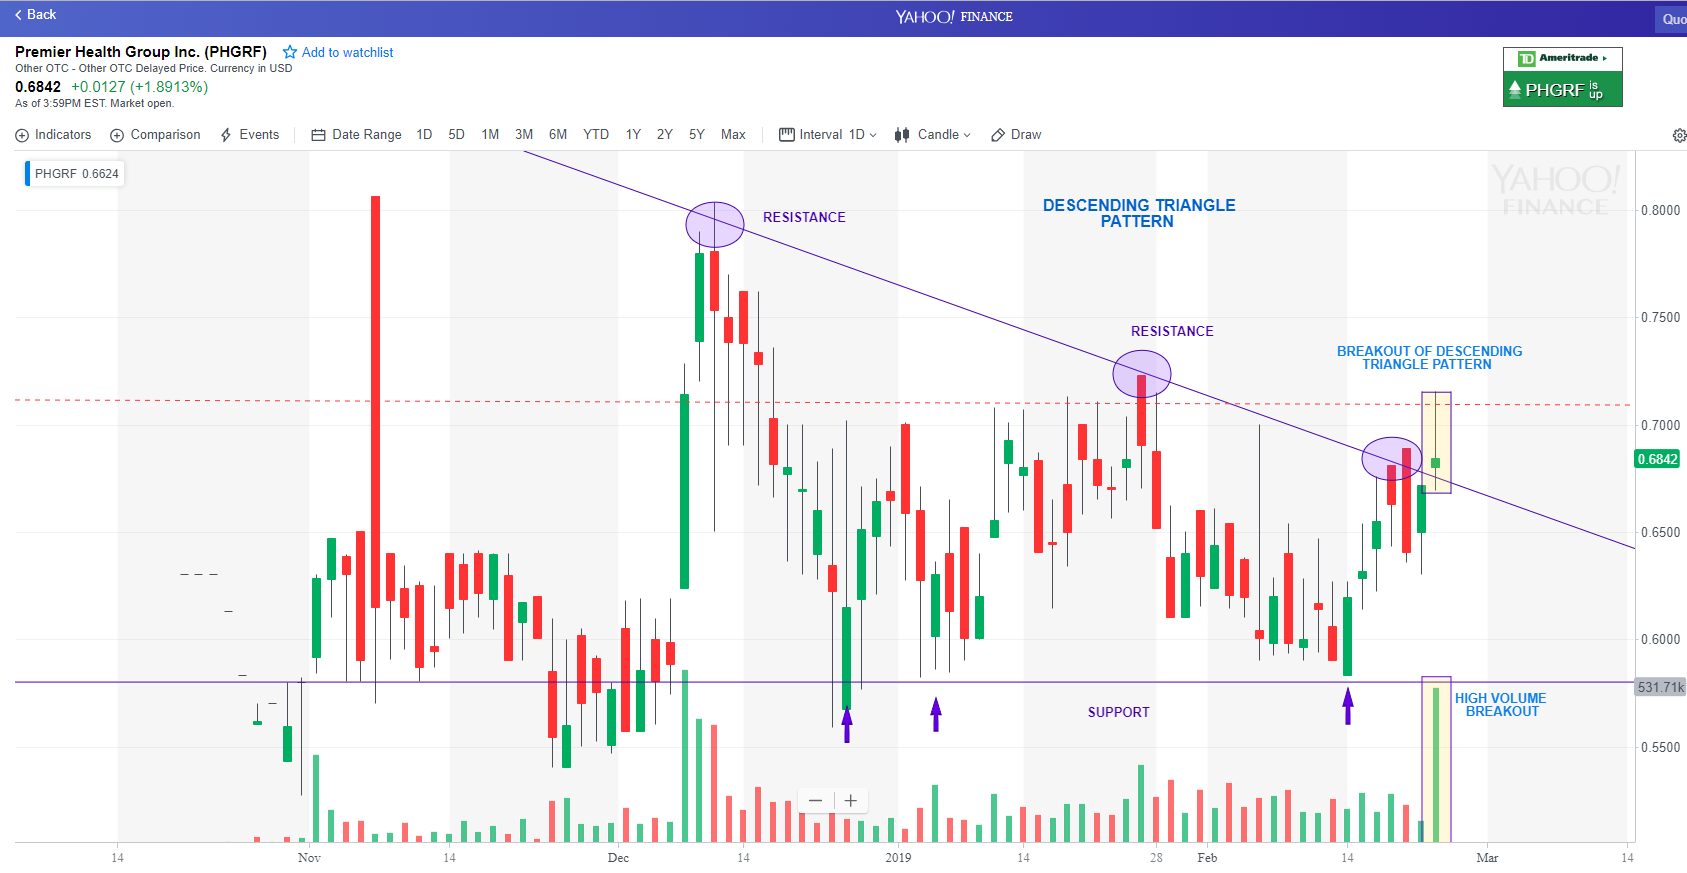
In the US, PHGRF has formed a descending triangle with clear support in the $0.58 area bouncing off this area multiple times since late December 2018. It’s important to note that Investopedia.com also mentions the more times a stock tests the support and resistance trendlines of a descending triangle pattern, the more reliable the pattern.
In the US, Premier Health Group Inc. (OTC: PHGRF) has tested the support trendline in the high $.50s about 14 times since the end of December 2018. This would be the area that short traders would look for the stock to break-down below. However, on February 25, 2019, (OTC: PHGRF) broke above the downtrend resistance line on a high increase in trading volume. Could this be the short squeeze action that Investopedia.com warned about?
Canadian Markets (CSE: PHGI)
In Canada, (CSE: PHGI) appears to show an even more clear descending triangle pattern with support in the high $0.70s. As you can see in the chart below, this support area was tested and held multiple times since late December 2018. And on February 25, 2019, (CSE: PHGI) broke out and above the downtrend resistance line on its heaviest trading volume day ever.

What’s Next?
If the support level in these descending triangle patterns held, and the stocks broke above the downtrend resistance line, what’s next for (OTC: PHGRF) / (CSE: PHGI)?
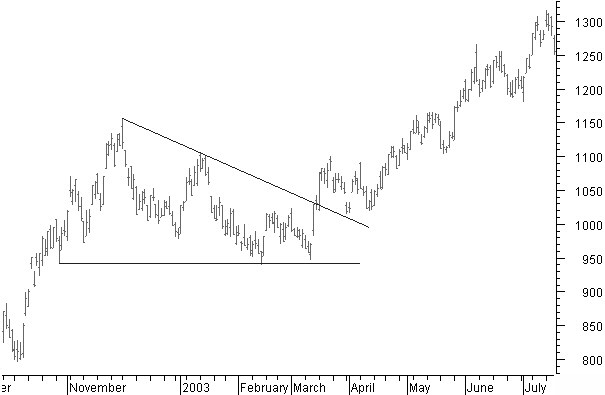
According to Stocata.org, when a descending triangle is formed during an uptrend on a daily chart and the price breaks above the downtrend resistance line, the previous uptrend is confirmed and the price continues to move in that direction. The site uses the below chart as an example:
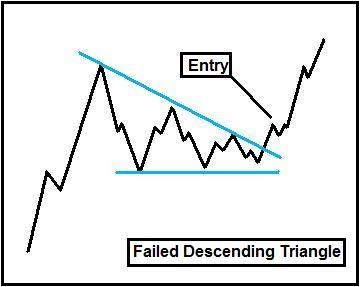
Ibankcoin.com also goes on to explain how a failed descending triangle can force shorts to cover their positions leading to a short squeeze. In fact, ibankcoin.com has this pattern listed as 1 of their 7 common breakout patterns. The site uses the below chart as an example:
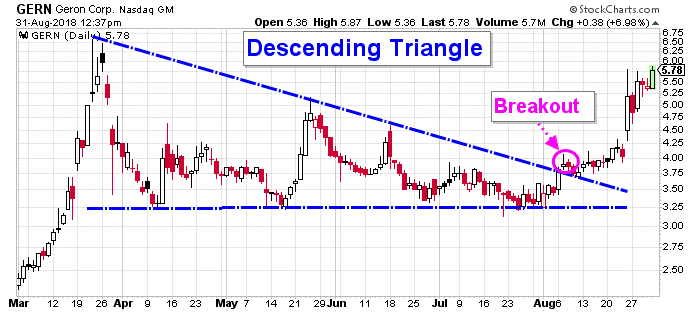
Lastly, profitconfidential.com identified a similar descending triangle breakout in their August 2018 analysis of stock ticker GERN. After identifying a break above the downtrend resistance line, this particular stock gained +52% less than 2 weeks following the breakout. The site uses the below chart in their analysis:
Conclusion
We now know that descending triangle patterns can tend to be heavily shorted in anticipation of the horizontal support level to breakdown. However, we now also know that when the support level holds, and the stock breaks out in the opposite direction above the downtrend resistance line, a short squeeze could follow.
After looking at the charts for (OTC: PHGRF) and (CSE: PHGI), it is our unprofessional opinion that a failed descending triangle pattern could be breaking above the downtrend resistance line. And, if the stock was being heavily shorted in anticipation of the horizontal support level breaking down, a short squeeze could soon follow. The abnormally high trading volume during the break above the downtrend resistance line further adds to the possibility of this potential outcome. This move occurred with the highest trading volume day ever in Canada and the second highest trading volume day ever in the US.
These technical indicators and patterns appear to have Premier Health Group Inc. (OTC: PHGRF) / (CSE: PHGI) setting up for a potential short squeeze and huge breakout move. The recent surge in trading volume could also be indicating the stock is coming out of a period of consolidation and is ready for its next move.
The long-term potential for Premier Health Group Inc., in our opinion, remains strong.
If You Have Not Already done so Please Check Out Our Full-Featured Profile Entitled
New Healthcare Stock for 2019 Has Ties to Cannabis & Huge Potential for Early Investors – Click Here
DISCLAIMER: Pursuant to an agreement between an affiliate of MAPH Enterprises, LLC (owners of MarijuanaStocks.com), MIDAM VENTURES, LLC and Premier Health Group Inc. Midam was hired for a period from 10/1/2018 – 4/1/2019 to publicly disseminate information about Premier Health Group Inc. including on the Website and other media including Facebook and Twitter. We were paid $300,000 (CASH) for & were paid “500,000” shares of restricted common shares (as of 1/2/2019). We own zero shares of Premier Health Group Inc., which we purchased in the open market. Once the (6) Six-month restriction is complete on 4/1/2019 we plan to sell the “500,000” shares of Premier Health Group Inc. that we hold currently in restricted form during the time the Website and/or Facebook and Twitter Information recommends that investors or visitors to the website purchase without further notice to you. We may buy or sell additional shares of Premier Health Group Inc. in the open market at any time, including before, during or after the Website and Information, provide public dissemination of favorable Information. FULL DISCLAIMER HERE
MAPH Enterprises, LLC | (305) 414-0128 | 1501 Venera Ave, Coral Gables, FL 33146 | new@marijuanastocks.com