

Today we are giving a cliffs notes version of ETF Rebalancing as we are under already under way with this process. First, here’s some info from the WWW.HorizonsETF.com website as a reference.
*HMMJ Rebalancing*
The Constituent Issuers of the Underlying Index will be market capitalization-weighted on each Rebalancing Date, subject to a cap for each Constituent Issuer of a maximum of 10% of the net asset value of Horizons HMMJ on each Rebalancing Date, with the remainder of the Constituent Issuers’ weights to be increased proportionately.
“Rebalancing Date” means, in respect of Horizons HOG and Horizons HMMJ, the third Friday in each of March, June, September and December; in respect of Horizons HII, the third Friday in each of May and November; in respect of Horizons INOC, the third Friday in each of April, July, October, and January; and in respect of Horizons ROBO, the third Friday in each of March, June, September, December
*MJ Rebalancing*
Alternative Harvest (MJ) ETF follows a similar model as Horizons ETF (OTC: HMLSF, TSX HMMJ.TO) on their rebalancing except the maximum net asset value for each security it holds can not exceed 7%. This ETF also begins its rebalancing at the first of each month once per quarter. Last Rebalance started on May 31st. The main difference between MJ & HMMJ is size of assets held. Currently MJ holds $346m in assets where HMMJ holds assets near $1b.
*Why is each quarterly rebalance important?*
The main reason I look at these ETF’s is to see where they have their money from a company standpoint as multi million-dollar investments are not something they take lightly, i.e. they are not investing in companies that simply say they are a cannabis-based company in the sector. This helps cut down on much of the noise we see in the markets. They also adhere to market cap minimums starting at $150m.
While this is helpful when making your decision, my favorite function of the ETF rebalance is knowing which companies will have to be trimmed down to the designated percentages of either 7% or 10%. This is a huge advantage for investors looking to trim profit, especially after massive runs we have seen the last 3 weeks. Knowing which companies will experience selling pressure during the rebalance period will provide investors and traders buying opportunities whilst preserving profit.
Simultaneously, while these ETF’s are taking profit in one company they are looking to reallocate that money into other securities under that threshold. It should be noted that just because a company is under the 7% or 10% level does not mean companies on the balance sheet are safe. Non-performers or companies that face negative head winds also get trimmed up during the process, but each day or following day the #ETF’s give an account of what they are holding. This allows the market to see when they are scaling in as well as scaling out of positions.
The scaling in and out process does not happen on one day, it is both gradual and methodical. ETF’s are not in the business of cutting off their nose to spite their face so don’t expect them to sell off a massive $50m chunk in one day. Obviously, the securities volume plays a big role in the scaling process. For example, I calculate about $14m worth of Canopy stock will have to be trimmed by $MJ ETF based on last Friday’s price.
This is nothing when you realize that Canopy traded on the NYSE $630m on Friday and $14m is just about 2% of the volume, meaning it will certainly be absorbed. Where you have to take out your calculator and do some estimating is on the $HMMJ ETF because its triple the size of $MJ because they do not list share counts on their site and just use percentages.
Due to lack of share count it’s easy to think that they are selling something if you don’t factor in that the percentage is based on the entirety of the ETF and those percentages fluctuate due to the performance of securities on that given day. For example if they had 10 companies in the fund that they bought each for $1 and one company’s stock price goes up $10 it will impact the other 9 companies percentage on the whole.
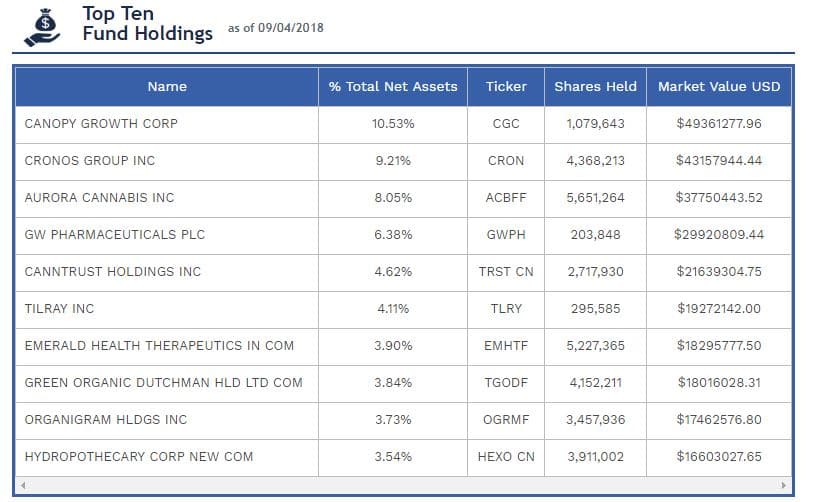
*Alternative Harvest top 10 holdings as of September 4th, 2018*
HMMJ Top 25 holding as of August 31st, 2018
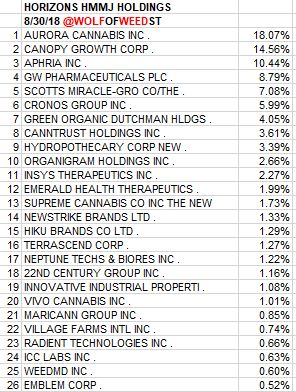
The above spread sheet of HMMJ might jump out at you because of the percentage they have in Aurora Cannabis (TSX: ACB.TO, OTC: ACBFF). The reason they have such a large percentage is due to the ETF having positions in companies Aurora has since acquired; Med-Releaf & CanniMed. As you can see this fund really likes companies that are in bed with Aurora and without naming any names so that we being objective, it is my opinion that HMMJ & MJ can have their cake and eat it too by investing in companies that Aurora has investments in under the idea that these are acquisition targets.
Keep in mind this idea can be universal for Canopy Growth Corp (NYSE: CGC, TSX: WEED.TO) or Cronos Group Inc (NASDAQ: CRON, TSX: CRON.TO) as two examples if companies meet market cap requirements. Again, this is an opinion that I think is worth considering.
As you can see by the holdings above of each ETF there are positions over the current percentages. Based on Friday’s close and values an estimated range per ETF percentage point is roughly as follows.
1% MJ = $3.46M
1% HMMJ = $10m
*Couple of side notes*
72 hours after a position is filled by an ETF they can lend to borrow short.
If there is a Big Short position and the ETF gets aggressive in buying, the probability of a short squeeze is higher than normal depending on percentage short vs the current float size.
If I was the ETF manager, I would scale into companies most equipped for the recreational market that begins on October 17th.
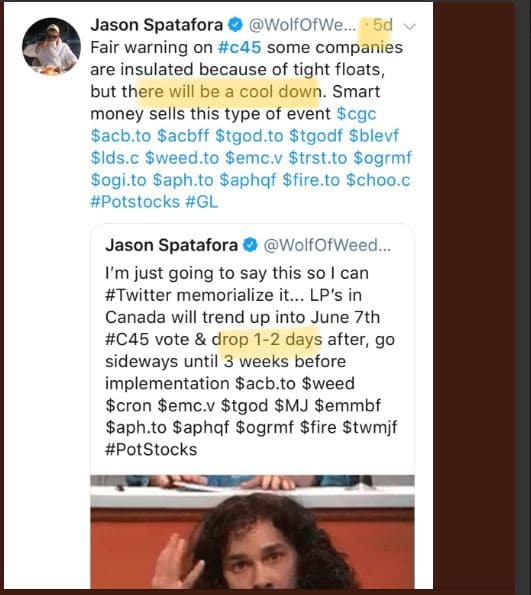
Alternative Harvest has “Call” & “Put” options that are worth looking at given the October 17th industry catalyst. As I have said on twitter (@WolfofWeedSt) I believe we will see a run up 2-3 weeks into implementation much like we did with the passage of #C45. I have taken a contrarian approach and look at this as “mostly” a sell the news event in the short term just as we saw on #c45, California going Rec 1/1/19, etc etc and that is how I am playing the event.
The thought process is either I take profit and get the anticipated dip or I take profit and market keeps going (win win). If I’m correct on the later, I will improve my cost basis going into December January where we have seen the highest prices in the market by year.
Hope this was a helpful reference point for your personal due diligence.
MAPH Enterprises, LLC | (305) 414-0128 | 1501 Venera Ave, Coral Gables, FL 33146 | new@marijuanastocks.com