
Our first Connect the Dots feature of 2019, Nabis Holdings (OTC: NABIF) (CSE: NAB), is already living up to the hype. As you know, our Connect the Dots features have become one of the most highly anticipated publications in the cannabis industry. And the excitement leading up to our first feature of 2019 was extraordinary as investors scour for an opportunity in this rapidly growing industry that is projected to be worth an astonishing $146.4 Billion by 2025. This trend of investors searching for growth and life-changing, wealth-generating opportunities in the cannabis space isn’t changing. But another trend is…
The Trend is Changing
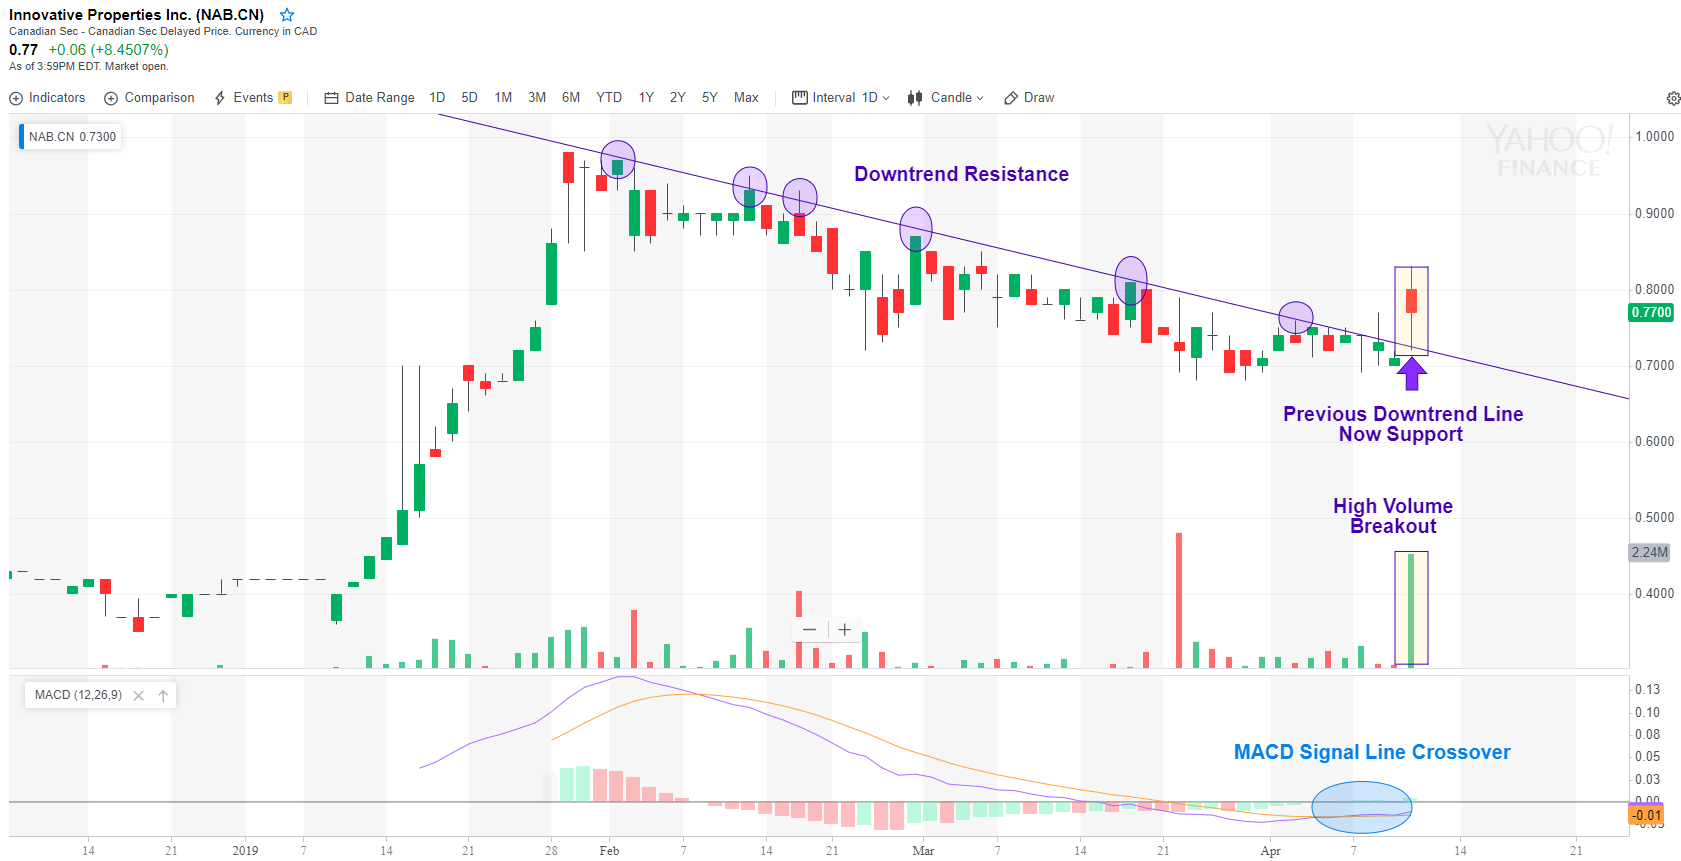
On April 11, 2019, our latest Connect the Dots Feature, (NABIF (CSE: NAB), seemed to have broken above a key downtrend resistance line that has held the stock down since early February 2019. Now, we are not licensed financial professionals, but it looks as though (NABIF) (CSE: NAB) had been in a clear downtrend for 2 months, until today. As you can see in the chart below, (NABIF) (CSE: NAB) gapped above the trendline on massive trading volume. Such heavy volume could also be a confirming breakout signal.
Investopedia.com defines a trendline as,
“A trendline is a line drawn over pivot highs or under pivot lows to show the prevailing direction of price. Trendlines are a visual representation of support and resistance in any time frame. They show direction and speed of price, and also describe patterns during periods of price contraction.”
And as you can see, (NABIF) (CSE: NAB) has just broken above that trendline.
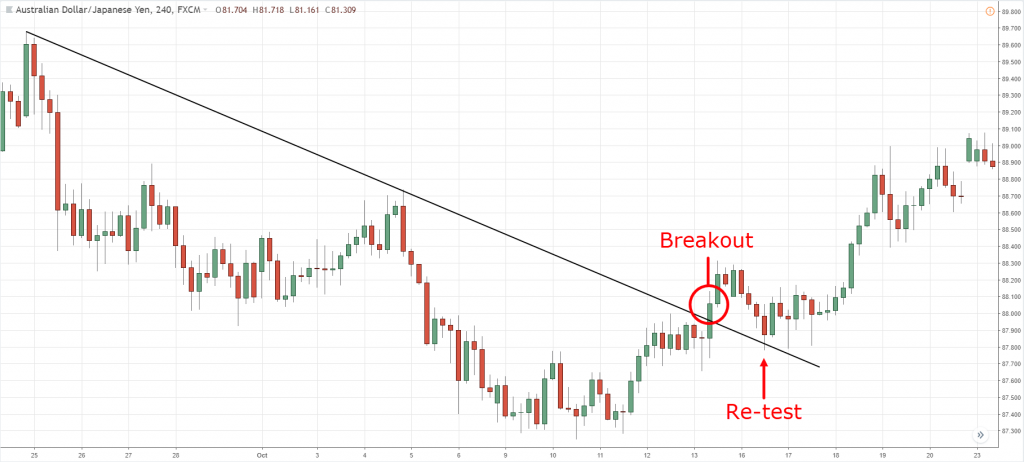
An educational trading website, tradingwithrayner.com, details a trading strategy centered specifically around buying trendline breakouts. The site explains,
“Introducing the Trend Line Breakout technique. Here’s how it works…
- Wait for a pullback in an uptrend
- Draw a Trend Line connecting the highs of the pullback
- If the price breaks the Trend Line, then enter the trade”
The educational website uses the following chart as an example:
tradingwithrayner.com goes on to say,
“Here’s the logic behind it…
If the price breaks above the Trend Line, it tells you the buyers are in control and the trend is likely to resume…”
They key takeaway and similarity that we notice between the Trading with Rayner example and the chart of (NABIF) (CSE: NAB), is the re-test of the downtrend line that was just broken. You will notice in the (NABIF) (CSE: NAB) chart earlier, we pointed out how the low of the day on April 11, 2019, lines up perfectly with the downtrend line drawn on the chart. It appears the previous downtrend resistance line is now acting as support, just like we can see in the Trading with Rayner example.
Another key take away from this is bullet point #1, “wait for a pullback in an uptrend.” One quick look at the (NABIF) (CSE: NAB) chart and you can clearly see a very strong uptrend during the month of January. The tock then experienced a 2-month slow pullback as the downtrend line was formed. And on April 11, 2019, the trendline was broken.
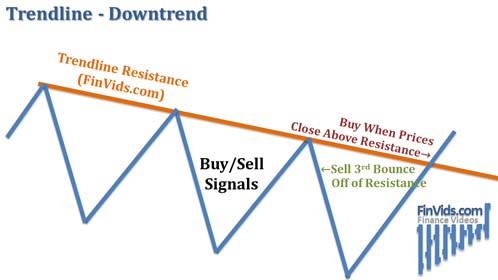
Another educational website, finvids.com, uses this chart example instructing readers to buy when the price closes above the resistance trendline:
Another Bullish Signal?
As we observe the (NABIF) (CSE: NAB) chart further, we notice what appears to be a second bullish signal. This signal could be confirming what the above-mentioned educational websites tell us about a new uptrend ensuing after the break above a downtrend line.
The Moving Average Convergence Divergence indicator, commonly referred to as the MACD, could be suggesting more upside is yet to come for (NABIF) (CSE: NAB).
According to a well-known stock site, stockcharts.com,
“The signal line is a 9-day EMA of the MACD line. As a moving average of the indicator, it trails the MACD and makes it easier to spot MACD turns. A bullish crossover occurs when the MACD turns up and crosses above the signal line.”
If you look to the bottom of the (NABIF) (CSE: NAB) chart above, you will see the MACD line has just recently crossed over the signal line. According to stockcharts.com, this is a bullish signal.
The website uses the below chart as an example:
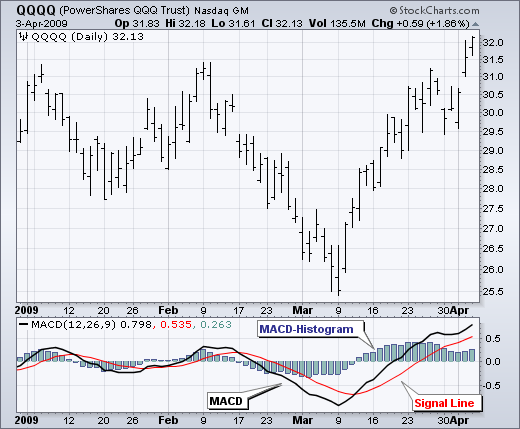
As you can see towards the bottom of the chart after the MACD (black line) crossed over the signal line (red line) a strong uptrend followed. And we see something very similar occurring in the chart of (NABIF) (CSE: NAB).
Strength in the Face of Weakness
As if these bullish indicators weren’t enough to get excited about, (NABIF) (CSE: NAB) displayed signs of extraordinary strength on a day the entire cannabis sector sold off. On the same day (NABIF) (CSE: NAB) broke above the downtrend resistance line, cannabis sector leaders like Canopy Growth (CGC), Tilray (TLRY), Aurora (ACB), and Cronos (CRON) all finished the day well in the red.
It could be a promising sign to see (NABIF) (CSE: NAB) make such a potentially bullish move on a day the rest of the cannabis sector is weak.
More Than Just the Technical
According to the information quoted from several educational trading websites, the possibility of Nabis Holdings experiencing a strong uptrend in the very near-term seems high. But don’t forget, there’s a lot more to (NABIF) (CSE: NAB) than just a sexy stock chart.
(NABIF) (CSE: NAB) has already closed some of the biggest agreements in the cannabis industry. Their exceptional management team is known for building tiny dreams of a company into industry leading titans. Just like when they co-founded MPX Bioceutical (CSE:MPX) and then merged with iAnthus for $835M CAD.
So as you can see, our first Connect the Dots feature of 2019 has A LOT of reasons for you to start paying attention to it right now.
Click Here To Read Our Full Profile on Nabis Holdings (OTC: NABIF) (CSE: NAB)
Disclaimer:
Pursuant to an agreement between an affiliate of MAPH Enterprises, LLC (owners of MarijuanaStocks.com), Midam Ventures LLC and Nabis Holdings, Midam has been paid $500,000 from Nabis Holdings for a period from 4/10/2019 to 7/25/2019. We may buy or sell additional shares of Nabis Holdings in the open market at any time, including before, during or after the Website and Information, to provide public dissemination of favorable Information about Nabis Holdings. Please Read Our Full Disclaimer by Clicking Here.
MAPH Enterprises, LLC | (305) 414-0128 | 1501 Venera Ave, Coral Gables, FL 33146 | new@marijuanastocks.com